|
Help Index
Overview
This program displays information about course and faculty evaluations from Spring 2001 on, and scheduling and enrollment information from Fall 2010 on.
Evaluations information comes from surveys completed by students at the end of every semester. Summaries of the data are displayed by instructor or by course, and include summaries of grade distributions (for courses taught Spring 2011 and later) drawn from CUNYfirst data feeds.
Schedule and enrollments information comes from CUNYfirst data feeds, refreshed at midnight every business day, providing close to live access to scheduling and enrollment statistics for the College. The data are displayed in tables that can be sorted by a number of different variables, and may be downloaded as CSV files, for further analysis.
Evaluations
Student evaluations of faculty and courses are mandated by the CUNY Board of Trustees (Manual of General Policy, Article V, Policy 5.21, "Student participation in decision-making processes"), as necessary sources of evidence in reappointment, tenure, or promotion recommendations. Evaluations data are also often examined in routine assessments of programs or college-wide curricula, and students make regular use of evaluations data to make informed choices about what courses to take. The displays of evaluations data provided by this application are designed to support all of these uses.
At Queens College, evaluations surveys were administered on paper from Spring 2001 through Spring 2008. An online system was adopted in fall 2008. (More information on how students submit evaluations is below.)
- New questionnaire: The survey currently in use at Queens College consists of 10 general questions about the course and the instructor, 4 questions related to writing (for courses designated as Writing Intensive only), and 3 open-ended questions for prose comments. This program displays summary data for the general questions, and provides downloadable spreadsheets with summaries of all quantitative data (including questions related to writing, where applicable). Comments are available only to faculty.
- Old questionnaire: A questionnaire in use from spring 2001 through spring 2010 consisted of 18 general questions about the course and instructor, and 3 open-ended questions for prose comments. Comments are available only to faculty, for courses offered fall 2008 and later.
Summary view
Summary pages display average ratings on a single bar graph, by instructor or course, for the six questions on the new questionnaire asked on a five-point scale (“Strongly Disagree” to “Strongly Agree”, displayed on the vertical axis), and for the corresponding questions on the old questionnaire.
- Select an Instructor (by typing in a name or selecting from the lists provided) or select a Course (within a given Program, by clicking on the corresponding course number), choose a semester from the pull-down menu (the default is the most recent semester for which there are data available), and select one or more courses.
- When viewing by Instructor, select at least one course; when viewing by Course, select at most one instructor.
- Download the data in CSV format by clicking on the link below the list of courses.
- Hover over any of the bars to see the text of the question.
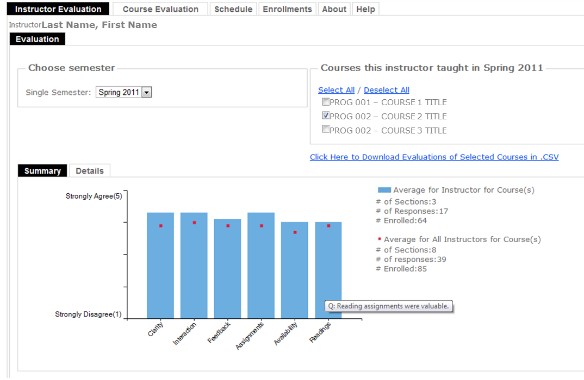
The blue bars represent average ratings for the selected instructor(s) or course(s), and the red dots the average for the comparison group (all instructors for the selected course or courses). Information about the total number of sections, responses, and students enrolled is provided on the right panel.
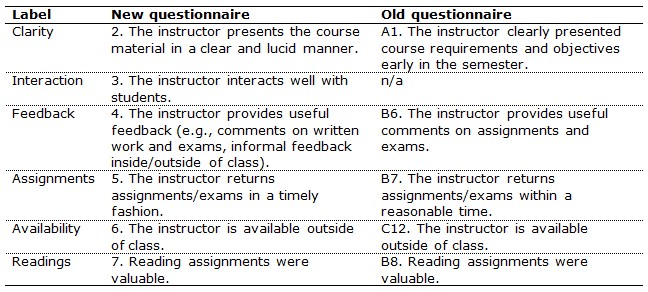
The questions in the old and new questionnaires are different, but these summary graphs provide averages for five questions that are almost identically worded in the two questionnaires.
The questions are the following (all answers on on a 5-point scale: 1=Strongly disagree, 5=Strongly agree):
Details view
Details pages are different for evaluations data for the new and the old questionnaire.
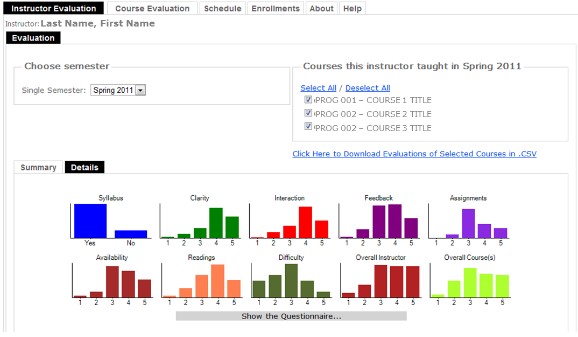
For the new questionnaire (courses in or after Spring 2010), the Details page provides histograms for each of the questions indicating, for any given question, the distribution of responses for each point on the scale.
- Click the “Show the Questionnaire...” button to display the complete text of the questionnaire, including the text for the scales (provided in parentheses).
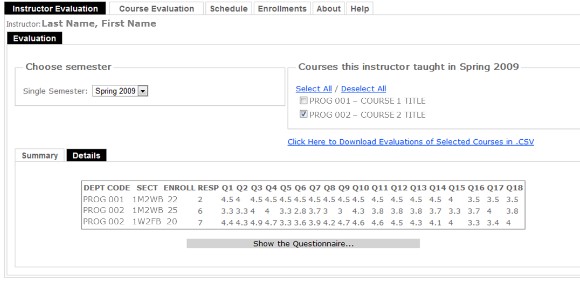
For the old questionnaire (courses in or before Fall 2009), the Details page provides a table including the means for each of the scalar-response questions in the old questionnaire.
- Click the “Show the Questionnaire...” button to display the complete text of the questionnaire, including the text for the scales (provided in parentheses).
- The table includes the number of students enrolled in each section (ENROLL), the number of respondents to the questionnaire (RESP) and the means for each question.
Viewing responses for Writing Intensive questions
The new questionnaire includes four questions for courses with a W (Writing Intensive) designation:
- The instructor provided opportunity for the revision of writing assignments.
- Class time is devoted to teaching elements of writing (argument, evidence, analysis, narrative, description, etc.) and the writing process (brainstorming, drafting, revising, etc.)
- The instructor assigned approximately how many pages of formal writing (essays, lab reports, narratives, etc.)?
- Compared to the amount of formal writing you did in this course, how much informal writing (journals, blogs, free-writing, etc.) did you do?
The data for these questions are not displayed on either the Summary or Details pages, but may be viewed by downloading the corresponding CSV file. In that file, responses for the four Writing Intensive questions are in columns labeled W1, W2, W3, W4.
Working with downloaded evaluations data
Complete evaluation data sets for selected instructors or courses may be downloaded as comma delimited CSV files, compatible with a number of spreadsheet applications, including Excel. These files include a row for each section selected, and columns containing the following:
- Course department/program code
- Course number
- Instructor’s name
- Course section code
- Course section number
- Average responses for questionnaire questions (new questionnaire: columns F-S; old questionnaire: columns F-W)
- Number of respondents contributing to the average (new questionnaire: column T; old questionnaire: column X)
- Number of students enrolled (new questionnaire: column U; old questionnaire: column Y)
Grades view
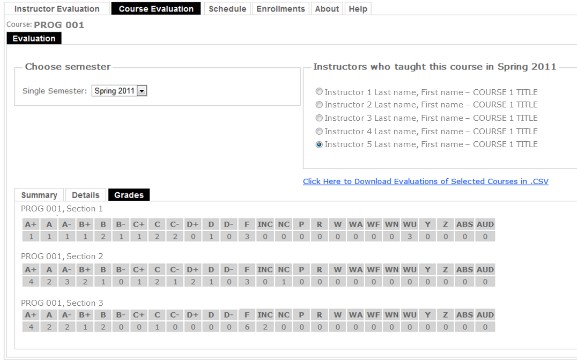
Summaries of grade distributions are available, for courses taught Spring 2011 and later. When a selected instructor taught more than one section of a given course, the course distributions are separated by section.
- Select Course Evaluation, choose a course offered Spring 2011 or later, select an instructor for this course, and click on Grades to view the table or tables.
- Review the University’s Grading Policy for details on grade equivalencies.
Accessing comments
Both the new and the old questionnaire ask students for optional written comments, in response to three questions:
- Please explain why you would or would not recommend this instructor to a friend.
- What did you like most about this class?
- What, if anything, could the instructor have done to improve the class?
Comments are available only to faculty, who may access them by logging in (using a faculty AD account) at: https://apps.qc.cuny.edu/courseevaluation/.
Schedules
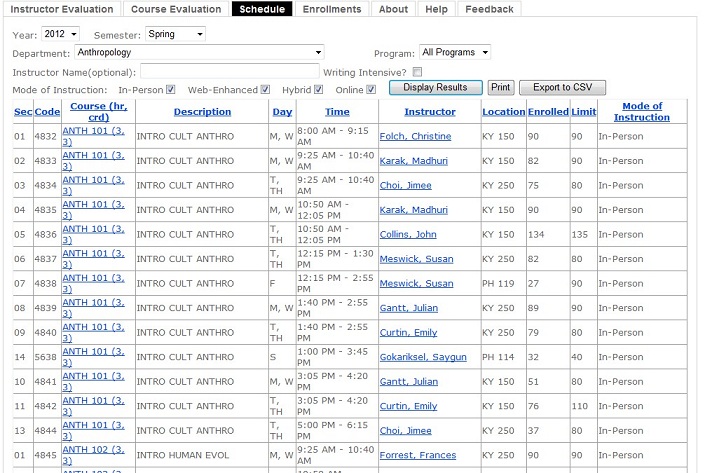
The Schedules tab displays tables containing information about the schedule, rooms, limits, and enrollment for courses, by Department and Program, for offerings from Fall 2010 on.
- Select a department and program and click “Display Results” to generate a table.
- Click on any header in the table to re-sort the data alphanumerically.
- Click on any course program acronym and number (the column titled “Course (hr, crd)”) to go to the corresponding evaluations data for that course.
- Click on any instructor’s name to go to the corresponding evaluations data for that instructor.
- Click “Print” for a printer-friendly version of any table currently displayed.
- Click on “Export to CSV” for a comma-delimited file containing the data currently displayed.
- Select “Writing Intensive” to view offerings with a W designation.
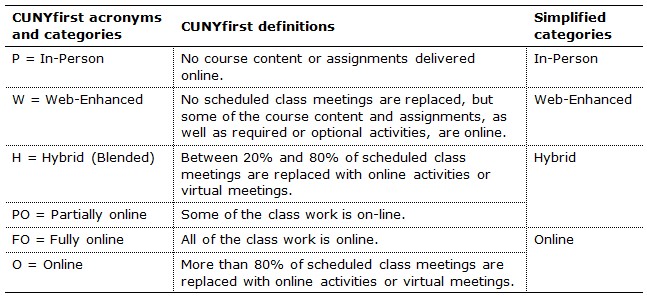
- Select a Mode of Instruction to view courses taught in traditional (completely face-to-face) or non-traditional (online, hybrid, or web-enhanced) modes. CUNYfirst categorizes mode of instruction using a six-way distinction. The tables displayed in the Schedules tab combine "Fully online" and "Online" into a single category ("Online"), and combine "Hybrid" and "Partially online" into a single category ("Hybrid"). For further details about the mode of instruction of any particular course (including information about the technological requirements for web-enhanced, hybrid, and online courses), please contact the instructor.
Notes:
- Team-taught courses or courses with more than one designated instructor appear multiple times, depending on the number of instructors. Section number, section code, course number and title, and schedule will be identical, but the instructors will be listed on separate rows, as in the following example:

- We are working to resolve an an issue sourced in our limited access to CUNYfirst data, which results in some Queens College instructors who are not on the Queens College payroll to not appear listed in the Schedule tables. For these courses, the “Instructor” column shows a comma (and clicking on the comma results in an error message), as in the following example:

- We are working to incorporate filters that will permit separate displays for course offerings that meet different requirements in the General Education curriculum, and course offerings with different modes of instruction (face-to-face, hybrid, online).
Enrollments
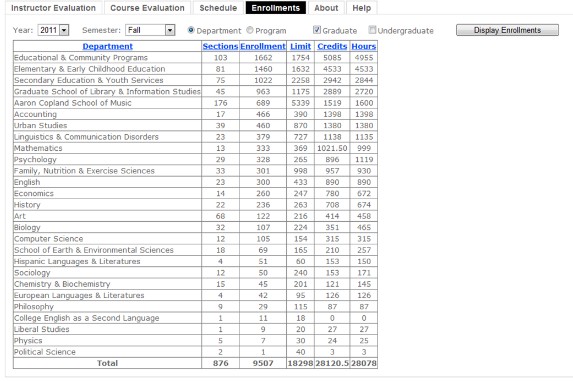
The Enrollments tab displays tables showing the number of enrollments and sections by Department or Program, for offerings from Fall 2010.
- Click on any header in the table to re-sort the data alpha-numerically.
- Select “Graduate” or “Undergraduate” to filter the data.
Submitting evaluations
The evaluations period is scheduled during the last four to five weeks of the fall and spring semester. There are no evaluations during the summer or winter sessions.
During the evaluations period, students are notified by email, and are directed to a website where they may complete the evaluations for the courses they are taking.
|